Boxing Fighter Pay - Multiple Regression
Introduction
In the following activity, you will use data compiled by Peter Anderson from the Nevada State Athletic Commission(NSAC) and the California State Athletic Commission(CSAC). The dataset covers professional boxing fights held between 2009 and 2017, which includes individual fighters, their opponents, fight characteristics, broadcasting networks, and fighter earnings.
Each observation represents a single fighter in a given bout, forming a structure that enables tracking of fighters over time.
Using this data, you will work on how various variables are correlated to fighter purse amount, as well as learn about how to determine the quality of a regression model.
Learning Goals
By the end of the activity you should be able to:
- Use Python to create models based on more than two predictors.
- Understand what Root Mean Squared Error(RMSE) is in the context of multiple regression.
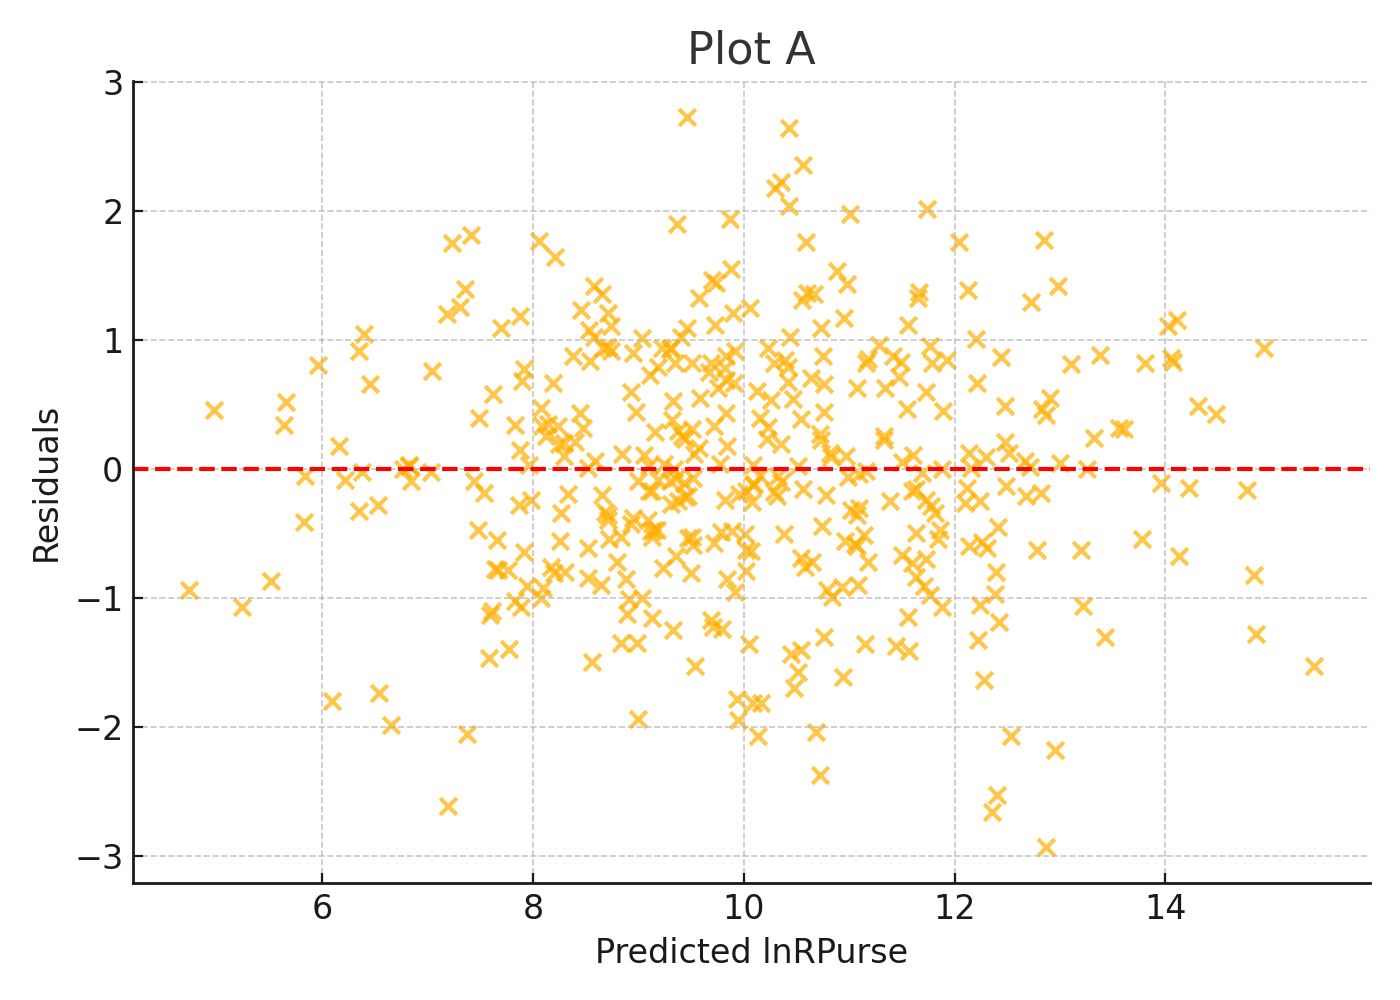
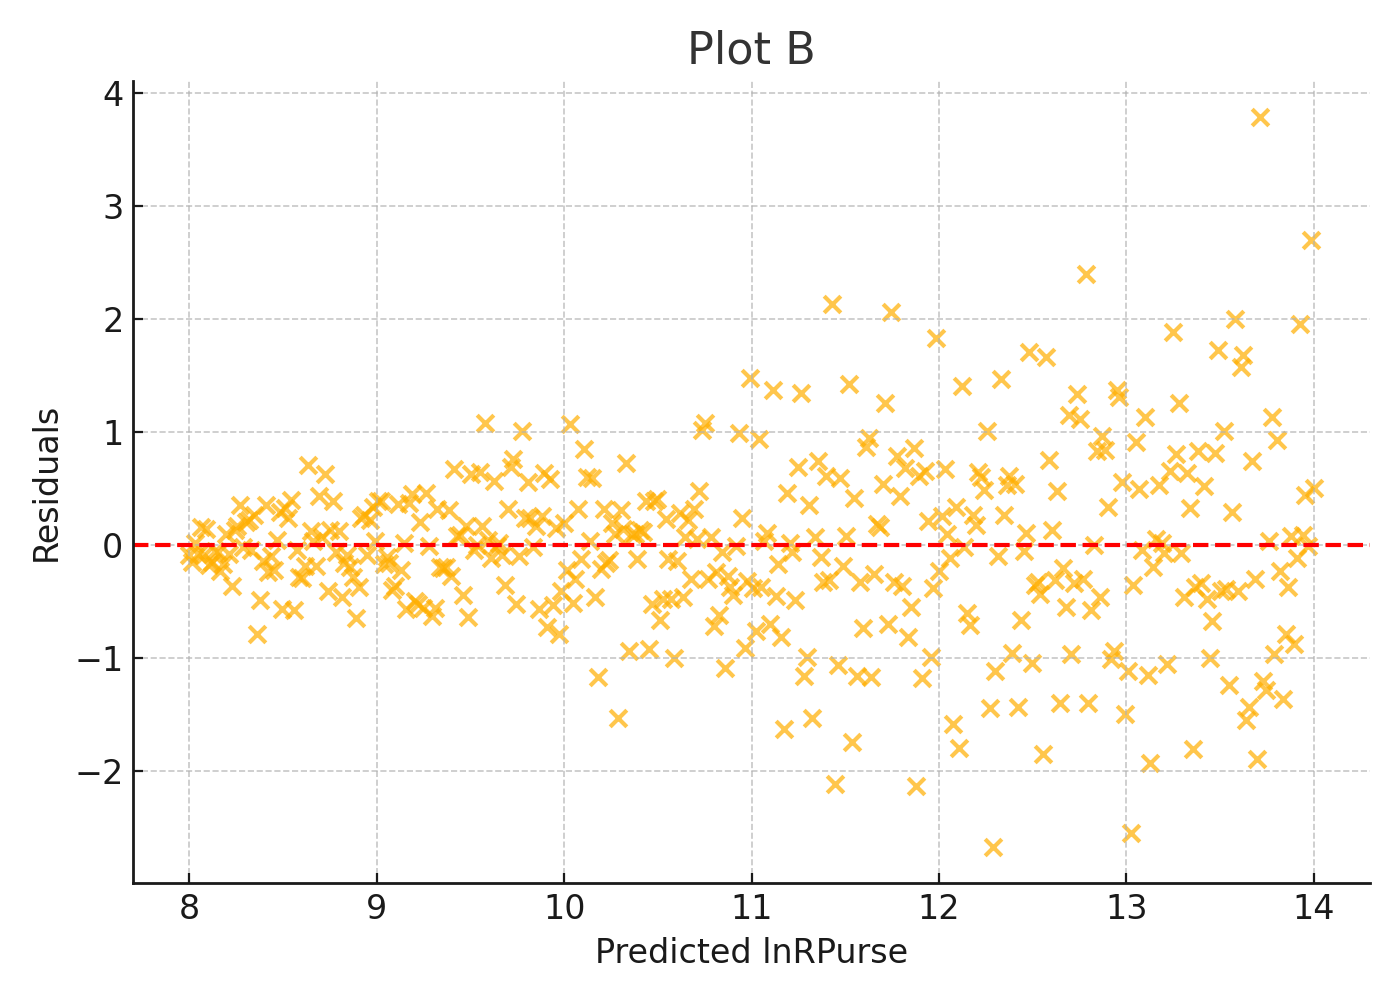
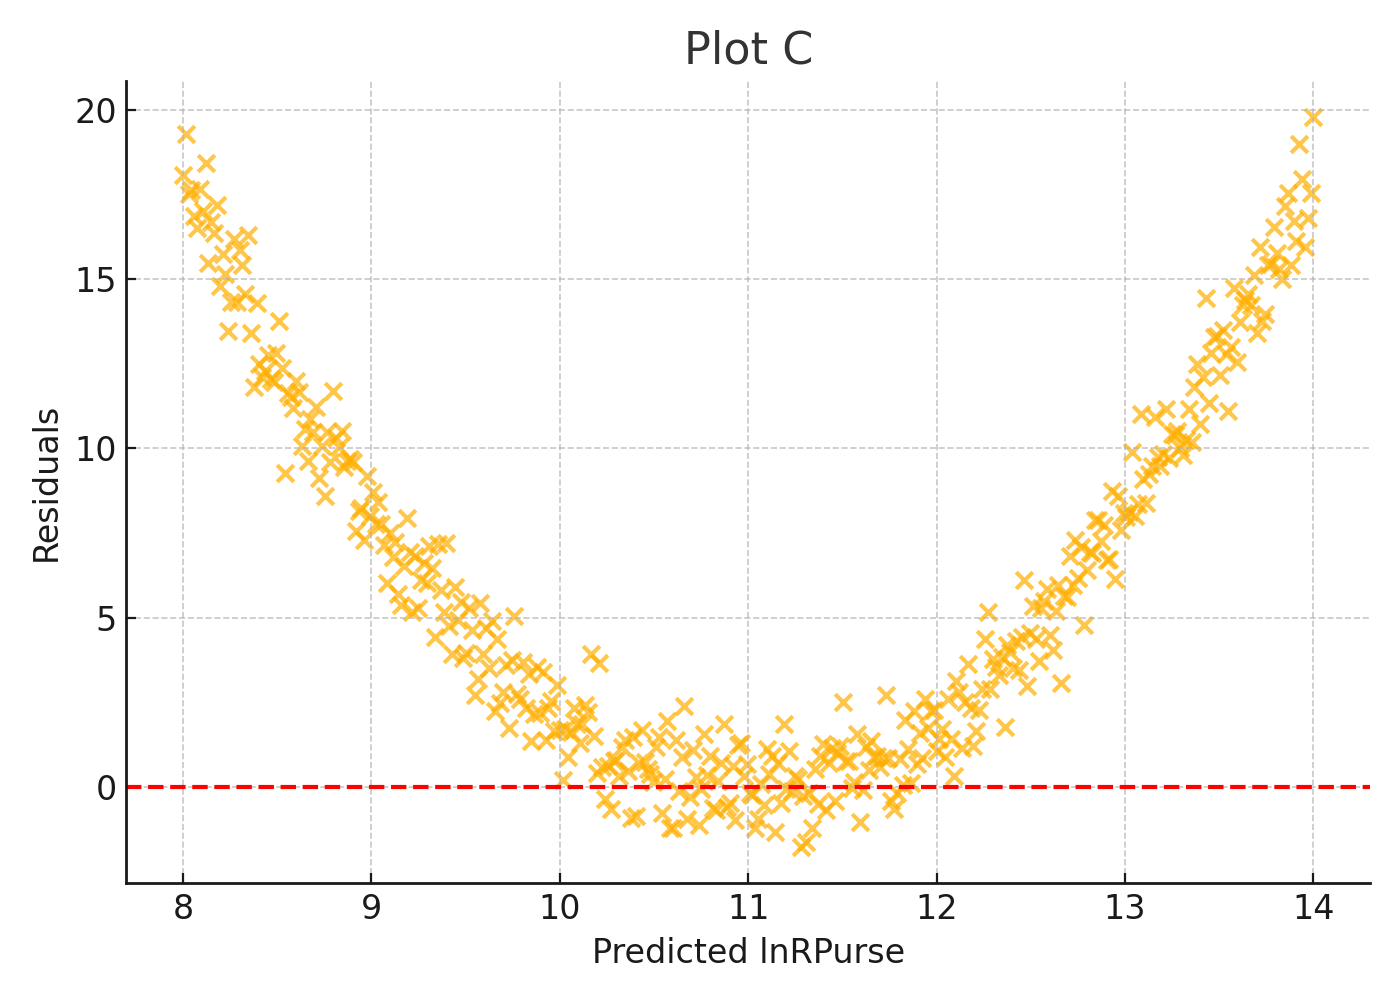
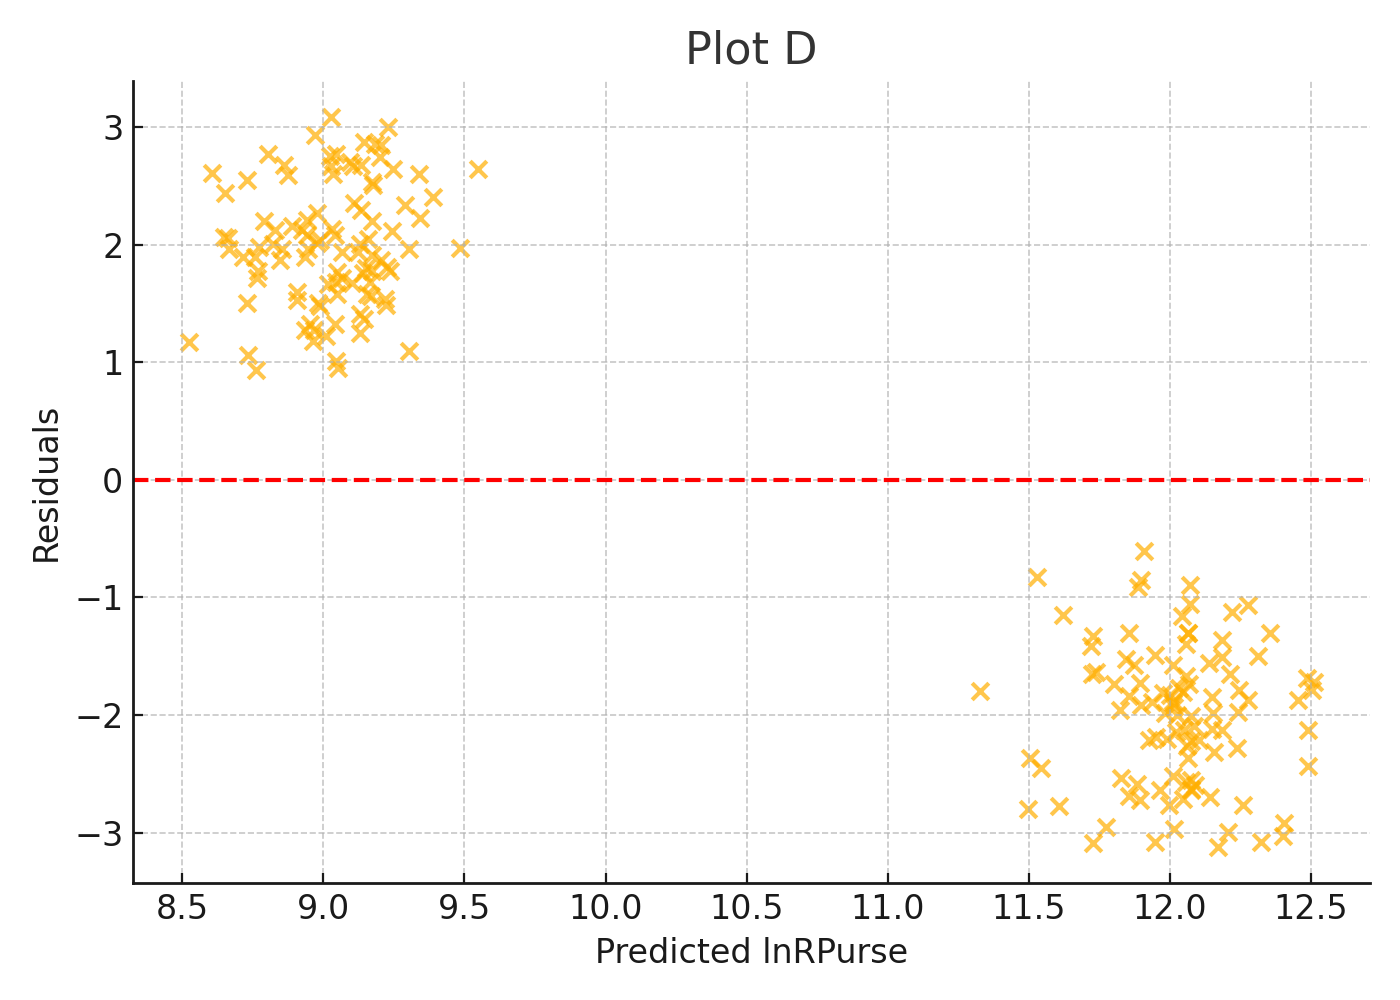
- Look at Residual plots to determine the quality of linear regression models.
- Use a variety of Python Libraries such as MatplotLib, Numpy, and Seaborn in creating models.
Data
The dataset includes over 4,600 fight entries and more than 1,200 unique professional boxers. Each row represents one fighter in one fight.
Variable Descriptions
| Variable | Description |
|---|---|
| Boxer | Name of the boxer (Last, First) |
| Date | Date of the fight (YYYY.MM.DD) |
| Purse | Reported purse (fighter’s earnings) in USD |
| lnRPurse | Natural logarithm of the purse (for regression use) |
| weight | Weight of the boxer (in pounds) |
| Age | Age of the boxer at the time of the fight |
| Wins | Number of professional wins prior to the fight |
| Losses | Number of professional losses prior to the fight |
| KO | Number of professional knockout wins prior to the fight |
| W-Title | Indicator for world title bout (1 = yes, 0 = no) |
| PPV | Fight was on Pay-Per-View (1 = yes, 0 = no) |
| RDS | Scheduled number of rounds |
Module Files
The full module materials are linked below.
Supporting Images
The module also includes the following residual plot images:
Module
This shell page provides access to the module materials. Download the student-facing Jupyter notebook and the supporting data file above to complete the activity.
To run the notebook, users will need a Python environment with packages such as pandas, numpy, matplotlib, seaborn, statsmodels, and scikit-learn.
Summary
In the provided material, students explored how to use multiple linear regression to model Boxing data. By building, evaluating, and interpreting regression models, students practiced core data science skills such as:
- Selecting and preparing predictor variables
- Understanding how each predictor influences the response
- Evaluating model performance using RMSE
- Diagnosing fit using residual plots
- Reading and interpreting a full regression summary